
Price candles or more commonly known as Japanese candlesticks, are a type of chart used in technical analysis to represent price movements of an asset, such as a currency pair or a stock. Each candlestick consists of a rectangular body and two lines extending from the body, called wicks or shadows. The body represents the difference between the opening and closing prices of the asset during a given time period, such as a day or a week, and is colored either red or black (or another color pairing) depending on whether the closing price was lower or higher than the opening price. The wicks represent the highest and lowest prices that the asset traded during that period. Japanese candlesticks can provide traders with valuable information about market sentiment, price trends, and potential reversal points, and are widely used in technical analysis as a tool for making trading decisions.
What are Candlestick Charts, and How Do They Work?
Candlestick charts are a popular type of financial chart used to represent the price movement of an asset, such as a currency pair or a stock, over a certain period of time. Each candlestick represents a single unit of time, such as a day, and shows the opening, closing, high, and low prices of the asset during that time period.
Candlestick charts are useful for traders as they provide a visual representation of price trends and market sentiment, and can help to identify potential reversal points or areas of support and resistance. Traders can use candlestick patterns, such as doji, hammer, and engulfing patterns, to make trading decisions based on the behavior of the market. Candlestick charts can be used in combination with other technical analysis tools, such as trendlines and moving averages, to gain a more complete picture of market trends and make informed trading decisions.
Anatomy of a Candlestick: Understanding the Different Elements
As reviewed briefly above, a Japanese candlestick is made up of four main parts: the opening price, the closing price, the high price, and the low price. These prices are represented in a visual format with a rectangular body and two lines, called wicks or shadows, extending from the top and bottom of the body.
The rectangular body of the candlestick represents the difference between the opening and closing prices of the asset during a given period of time, such as a day or a week. If the closing price is higher than the opening price, the body is typically colored black or green. If the closing price is lower than the opening price, the body is typically colored red or orange. The color of the body can vary between different trading platforms and charting software.
The wicks or shadows of the candlestick represent the highest and lowest prices that the asset traded during that period of time. The upper wick represents the highest price that the asset traded during that period, while the lower wick represents the lowest price. The length of the wicks can vary depending on the volatility of the asset during that time period.By looking at the shape and color of the candlestick, traders can gain insight into market sentiment and potential price trends.
Types of Price Candles: Bullish, Bearish, and Neutral
Traders can interpret Japanese candlesticks by analyzing the shape, color, and position of the candlesticks on a chart. Here are a few key ways that traders use Japanese candlesticks in their analysis:
- Trend identification: Traders look for patterns of candlesticks that indicate a trend is forming. For example, a series of candlesticks with long bodies and small wicks may indicate a strong trend is forming, while candlesticks with small bodies and long wicks may indicate a trend is weakening.
- Support and resistance: Traders also look for candlestick patterns that indicate areas of support or resistance. For example, a long lower wick on a candlestick may indicate that buyers are entering the market at a certain price level, creating a support level.
- Reversals: Traders can use certain candlestick patterns to identify potential reversal points in the market. For example, a hammer candlestick pattern, where the candlestick has a long lower wick and a small body, may indicate that a bearish trend is about to reverse.
- Market sentiment: Traders can use the color of the candlesticks to gauge market sentiment. For example, a series of green candlesticks may indicate bullish sentiment, while a series of red candlesticks may indicate bearish sentiment.
Common Candlestick Patterns and How to Use Them in Trading
As we have seen, candlestick patterns are a popular tool used by traders to analyze price movements and make informed trading decisions. By studying the shapes, colors, and positions of the candlesticks on a chart, traders can identify patterns that indicate potential trends, support and resistance levels, and potential reversal points in the market. Traders use candlestick patterns in combination with other technical analysis tools, such as trendlines and moving averages, to gain a more complete picture of market trends and make more informed trading decisions. By understanding candlestick patterns and their significance, traders can improve their chances of success in the financial markets.
Reversal Patterns: Engulfing, Star, Hammer, and Doji
There are several candlestick reversal patterns that traders commonly use to identify potential trend reversals in the market. Here are a few examples:
- Hammer: A hammer candlestick pattern is characterized by a small body and a long lower wick. It indicates that buyers entered the market and pushed the price up after a period of selling pressure.
- Shooting star: A shooting star candlestick pattern is characterized by a small body and a long upper wick. It indicates that sellers entered the market and pushed the price down after a period of buying pressure.
- Engulfing: An engulfing candlestick pattern occurs when a large bullish or bearish candlestick completely engulfs the previous candlestick. It indicates a potential trend reversal, as the momentum shifts from buying to selling or vice versa.
- Doji: A doji candlestick pattern occurs when the opening and closing prices are very close together, resulting in a small body and long wicks. It indicates indecision in the market and a potential reversal of the current trend.
Continuation Patterns: Flag, Pennant, and Wedges
Candlestick continuation patterns are chart patterns that suggest a continuation of an existing trend. Here are some examples of common candlestick continuation patterns:
- Bullish or bearish flag: A flag pattern is characterized by a brief period of consolidation following a strong price move, and is considered a continuation pattern because the price tends to move in the direction of the initial trend after the consolidation phase.
- Pennant: A pennant pattern is similar to a flag pattern, but is typically shorter in duration and has a more triangular shape. It indicates a brief pause in the trend before the price continues in the same direction.
- Rising or falling wedge: A wedge pattern is a triangle shape that forms between two trendlines. A rising wedge is a bearish pattern that indicates the price is likely to continue lower, while a falling wedge is a bullish pattern that suggests the price is likely to continue higher.
- Rectangle: A rectangle pattern is characterized by two parallel horizontal trendlines that bound the price action within a range. This pattern indicates a pause in the trend before the price continues in the same direction.
Traders use these and other candlestick continuation patterns to identify potential continuation of an existing trend, and adjust their trading strategies accordingly. By understanding these patterns, traders can better anticipate market movements and make more informed trading decisions.
How to Use Candlestick Charts in Forex Trading
Candlestick charts in forex trading are used to visualize price movements over a specific time period. The x-axis of the chart represents the time period, while the y-axis represents the price. Each candlestick on the chart represents a specific time frame, such as one minute, one hour, one day, or one week, depending on the trader’s preference and trading strategy.
Traders may use different time frames for candlestick charts depending on their trading style and objectives. For example, day traders may use candlestick charts with a time frame of one minute or five minutes to capture short-term market movements, while swing traders may use charts with a time frame of one day or one week to capture longer-term trends. By selecting the appropriate time frame for their trading strategy, forex traders can better understand market movements and make more informed trading decisions.
Technical Analysis: Combining Candlestick Charts with Indicators
There are several technical indicators that traders often use in conjunction with candlestick charts to analyze forex markets. Here are a few of the most common ones:
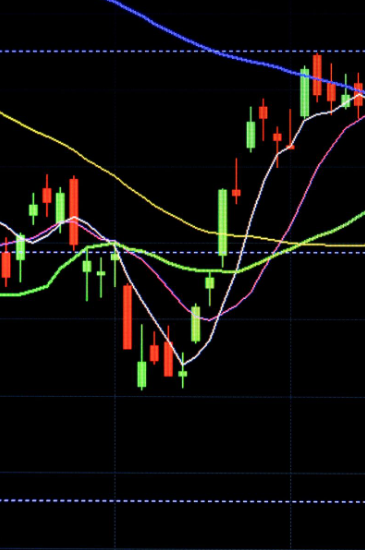
- Moving Averages: Moving averages are used to identify trends and to smooth out price movements over a specified time period. They are often used to confirm trend reversals identified by candlestick patterns.
- Relative Strength Index (RSI): The RSI is a momentum indicator that measures the strength of a security’s price action. It is often used to confirm overbought or oversold conditions identified by candlestick patterns.
- Bollinger Bands: Bollinger Bands are a volatility indicator that consists of a set of three bands plotted on the price chart. They are often used to identify potential breakouts and to confirm trend reversals identified by candlestick patterns.
- Moving Average Convergence Divergence (MACD): The MACD is a trend-following momentum indicator that shows the relationship between two moving averages of a security’s price. It is often used to identify trend reversals and to confirm signals identified by candlestick patterns.
These and other technical indicators are often used in conjunction with candlestick charts to provide a more complete picture of the forex market and to identify potential trading opportunities. By combining candlestick patterns with technical indicators, traders can develop a more comprehensive trading strategy that takes into account multiple factors affecting market movements.
Fundamental Analysis: Using Candlestick Charts to Analyze News and Market Sentiment
Candlestick charts can be used to analyze risk events, news, and sentiment in the forex markets by providing traders with a visual representation of market movements over time. When combined with fundamental analysis and news events, candlestick charts can help traders identify potential trading opportunities and manage risk. For example, candlestick patterns that indicate bullish sentiment may suggest that a particular currency pair is likely to appreciate in value, while patterns that indicate bearish sentiment may suggest the opposite. By monitoring candlestick patterns and technical indicators in real-time, traders can stay informed about market movements and adjust their trading strategies accordingly to manage risk and capitalize on market opportunities.
Conclusion: Mastering Price Candles in Forex Trading
To master the reading and analysis of candlesticks and patterns in forex, it’s important to follow a systematic approach that combines both theoretical and practical learning. Here are a few steps that can help:
- Learn the basics: Start by learning the basics of candlestick charts and patterns, including the meaning of different candlestick shapes, wicks, and shadows, as well as the most common candlestick patterns and their implications.
- Study examples: Study real-life examples of how candlestick patterns have played out in the forex markets, both historically and in real-time. This can help you understand how candlestick patterns can be used to predict market movements and make informed trading decisions.
- Practice, practice, practice: Practice analyzing candlestick charts and patterns on demo accounts or with small amounts of real money. This can help you gain experience and confidence in your ability to read and interpret candlestick charts.
- Use technical analysis tools: In addition to candlestick charts, use technical analysis tools such as moving averages, Bollinger Bands, and RSI to confirm or supplement your analysis of candlestick patterns.
- Stay up-to-date: Keep up-to-date with market news and events that may impact forex prices, and be aware of any potential risks or opportunities that may arise.
By following these steps and continuing to hone your skills over time, you can become proficient in reading and analyzing candlestick charts and patterns in forex, and develop a sound trading strategy that can help you achieve your financial goals.