
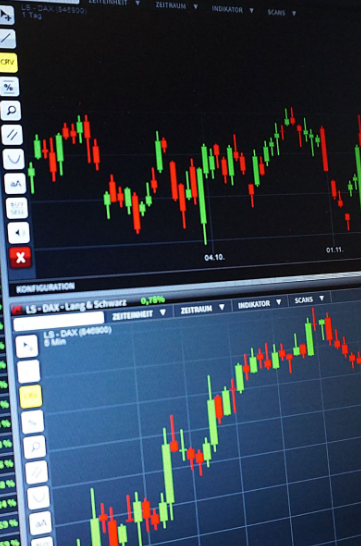
What are Trend Lines in Forex Trading?
Trend lines in forex trading are graphical representations of the direction and momentum of price movements in a currency pair. These lines are drawn on a chart connecting a series of lows or highs to create a trend. The trend line helps traders identify support and resistance levels, as well as potential reversal or continuation points in the market. Trend lines can be used in conjunction with other technical analysis tools to generate trading signals and make informed trading decisions.
The Importance of Trend Lines in Forex Trading
Trend lines are important in forex trading for several reasons. First, they provide a visual representation of the market trend, which can help traders identify potential trading opportunities. By drawing a trend line, traders can quickly assess the direction and strength of the trend. Second, trend lines can act as a support or resistance level, providing traders with an entry or exit point for their trades. Third, trend lines can be used in combination with other technical analysis tools, such as moving averages or oscillators, to confirm signals and generate trade ideas. Finally, trend lines can also help traders manage their risk by setting stop-loss orders at key support or resistance levels. Overall, trend lines are a useful tool for forex traders to analyze market trends, identify potential trading opportunities, and manage risk.
How to Draw Trend Lines in Forex Trading
When analyzing forex charts, trend lines are drawn by connecting two or more key price points in a currency pair. To draw an uptrend line, a trader will connect two or more lows on the chart, with the line slanting upwards from left to right. To draw a downtrend line, the trader will connect two or more highs on the chart, with the line slanting downwards from left to right.

Once the trend line is drawn, the trader can then use it to identify potential support or resistance levels. For an uptrend line, the line will act as a support level, indicating where traders may want to enter into long positions. For a downtrend line, the line will act as a resistance level, indicating where traders may want to enter into short positions.
It’s important to note that trend lines are subjective and can vary depending on the timeframe and the chart used. Traders may also use other technical analysis tools, such as moving averages or Fibonacci retracements, to confirm the trend line and generate trading signals.
Identifying Uptrends and Downtrends in Forex Trading
To identify uptrends and downtrends in forex trading, traders often use technical analysis tools such as charts and indicators. Here are some common methods used to identify these trends:
- Price action: The most basic method of identifying trends is to look at the price action on the chart. An uptrend is characterized by a series of higher highs and higher lows, while a downtrend is characterized by a series of lower highs and lower lows.
- Moving averages: Traders can use moving averages to help identify the direction of the trend. A simple moving average (SMA) can be used to smooth out price fluctuations and show the overall direction of the trend. When the price is above the moving average, it indicates an uptrend, while when the price is below the moving average, it indicates a downtrend.
- Trend lines: As mentioned earlier, trend lines can be used to identify uptrends and downtrends. An uptrend line is drawn by connecting two or more lows, while a downtrend line is drawn by connecting two or more highs.
- Technical indicators: There are many technical indicators that traders can use to identify trends, such as the Moving Average Convergence Divergence (MACD), Relative Strength Index (RSI), and the Average Directional Index (ADX).
Overall, identifying trends in forex trading requires a combination of these methods and an understanding of the current market conditions.

Using Price Points to Draw Trend Lines in Forex Trading
To draw trend lines using price points in forex trading, traders need to identify key levels of support and resistance on a chart. To draw an uptrend line, traders should identify two or more swing lows on the chart and connect them with a straight line, with the line slanting upwards from left to right. To draw a downtrend line, traders should identify two or more swing highs on the chart and connect them with a straight line, with the line slanting downwards from left to right.
Connecting Swing Highs and Swing Lows to Draw Trend Lines in Forex Trading
Connecting swing highs and swing lows is a common method used to draw trend lines in forex trading. Swing highs and swing lows are key price points on a chart where the price has reversed direction, indicating a potential change in the trend.
To draw an uptrend line, traders will look for at least two swing lows and connect them with a straight line, with the line slanting upwards from left to right. The resulting trend line acts as a support level, indicating where traders may want to enter into long positions.
Conversely, to draw a downtrend line, traders will look for at least two swing highs and connect them with a straight line, with the line slanting downwards from left to right. The resulting trend line acts as a resistance level, indicating where traders may want to enter into short positions.
By connecting swing highs and swing lows, traders can identify the direction of the trend and potential areas of support and resistance.
How to Use Trend Lines in Forex Trading
Identifying Support and Resistance Levels with Trend Lines
Traders can identify support and resistance levels using trend lines in forex trading. When a trend line is drawn, it can act as a potential support or resistance level depending on the direction of the trend. Here’s how traders can identify support and resistance levels using trend lines:
- Uptrend line as support: An uptrend line is drawn by connecting two or more swing lows on a chart. When the price approaches the uptrend line, it is considered a potential support level. Traders may look for opportunities to enter long positions near the uptrend line, with a stop-loss order placed below the line to limit potential losses.
- Downtrend line as resistance: A downtrend line is drawn by connecting two or more swing highs on a chart. When the price approaches the downtrend line, it is considered a potential resistance level. Traders may look for opportunities to enter short positions near the downtrend line, with a stop-loss order placed above the line to limit potential losses.
- Breakouts: When the price breaks through a trend line, it can indicate a potential change in the trend. For example, when an uptrend line is broken, it may signal a shift to a downtrend. Traders may look for opportunities to enter trades in the direction of the breakout, with a stop-loss order placed on the other side of the trend line to limit potential losses.
Utilizing Trend Lines for Entry and Exit Points in Forex Trading
Traders can use trend lines to find potential entry and exit points for trades in forex trading. Here are some ways traders can use trend lines for this purpose:
- Entry points: Traders can look for opportunities to enter trades when the price approaches a trend line. For example, in an uptrend, traders may look for opportunities to buy near the uptrend line, while in a downtrend, traders may look for opportunities to sell near the downtrend line. Traders may also use other technical analysis tools such as oscillators or indicators to confirm signals and generate trade ideas.
- Stop-loss orders: Traders can use trend lines to set stop-loss orders to limit potential losses. For example, in an uptrend, traders may set a stop-loss order below the uptrend line, while in a downtrend, traders may set a stop-loss order above the downtrend line.
- Exit points: Traders can use trend lines to find potential exit points for trades. For example, in an uptrend, traders may look to exit long positions when the price approaches the upper trend line or other key resistance levels. In a downtrend, traders may look to exit short positions when the price approaches the lower trend line or other key support levels.
Combining Trend Lines with Other Technical Indicators for Maximum Profitability
Traders can combine trend lines with other indicators to maximize profits in forex trading. Here are some ways to do this:
- Moving Averages: Traders can use moving averages with trend lines to confirm the direction of the trend. For example, traders can use a 50-day moving average with an uptrend line to confirm an uptrend, or a 200-day moving average with a downtrend line to confirm a downtrend. When the price is above the moving average and the trend line, it may indicate a stronger bullish signal, while when the price is below the moving average and the trend line, it may indicate a stronger bearish signal.
- Oscillators: Traders can use oscillators with trend lines to identify overbought or oversold conditions. For example, traders can use the Relative Strength Index (RSI) with an uptrend line to identify overbought conditions, or the Stochastic oscillator with a downtrend line to identify oversold conditions. When the oscillator signals a reversal, it may indicate a potential trend change, and traders can use the trend line as a confirmation.
- Fibonacci Retracements: Traders can use Fibonacci retracements with trend lines to identify potential levels of support or resistance. For example, traders can draw a Fibonacci retracement from the swing high to the swing low in an uptrend, and use the retracement levels to identify potential support levels. Traders can then use the trend line to confirm the support level and look for opportunities to enter long positions.
By combining trend lines with other indicators, traders can confirm signals and generate trade ideas with greater accuracy.
Common Mistakes to Avoid When Using Trend Lines in Forex Trading
Failing to Identify Relevant Swing Highs and Swing Lows for Drawing Trend Lines
Failing to identify relevant swing highs and lows when drawing trend lines in forex trading can lead to inaccurate trend lines and potentially incorrect trading decisions. Here are some potential consequences:
- Inaccurate trend lines: If traders fail to identify relevant swing highs and lows, they may draw trend lines that do not accurately represent the direction of the trend. This can lead to false signals, such as false breakouts or breakdowns, and potentially incorrect trading decisions.
- Missed opportunities: If traders fail to identify relevant swing highs and lows, they may miss important support and resistance levels. This can lead to missed trading opportunities, as traders may not be able to identify key levels for entering or exiting trades.
- Increased risk: If traders rely on inaccurate trend lines, they may be exposed to increased risk. For example, if traders enter long positions based on an uptrend line that is not accurately drawn, they may be at risk of losses if the trend line is broken.
Overcomplicating Trend Line Analysis with Too Many Indicators
Using too many indicators in forex trading can lead to analysis paralysis and potentially inaccurate trading decisions. Traders may get conflicting signals from different indicators or become overwhelmed with information, leading to indecision or overtrading. Additionally, using too many indicators can lead to overfitting, where traders optimize their strategy for historical data but perform poorly in real-world trading conditions. Therefore, it’s important for traders to use a limited number of indicators that complement each other and provide clear and actionable signals.
Ignoring Other Important Factors Affecting Forex Market Trends
When identifying trends in forex trading, traders should take into account some often ignored factors, including:
- Timeframes: Trends may vary across different timeframes, so traders should analyze multiple timeframes to get a complete picture of the trend. For example, a currency pair may be in an uptrend on a daily chart but in a downtrend on a 1-hour chart.
- Market conditions: Trends may change in response to changing market conditions, such as news events, economic data releases, or geopolitical events. Traders should monitor market conditions and adjust their trading strategy accordingly.
- Volume: Changes in trading volume can indicate a potential trend reversal or continuation. For example, if trading volume increases during a price breakout, it may indicate a strong trend and present an opportunity for traders to enter a trade.
- Sentiment: Market sentiment can influence the direction of a trend, and traders should be aware of market sentiment indicators such as the Commitment of Traders (COT) report or surveys of market participants.
Conclusion
In summary, trend lines are an essential tool in forex trading used to identify trends, support and resistance levels, and potential trade entry and exit points. However, it’s important to identify relevant swing highs and lows when drawing trend lines to ensure accuracy and make informed trading decisions. Traders should also use a limited number of indicators that complement each other and consider often ignored factors such as timeframes, market conditions, volume, and sentiment to get a complete picture of the trend and make profitable trades.